
In this post I’m going to mailing cover the TraceView which is a pretty powerful way to view the UI events and methods executed (during normal UI interaction).
The solution (skipped with TeamMentor) is based on the http://interlogy.com/~cigdem/trace/:
To access it in TeamMentor, the config settings to change are the window.TM.Debug.show_DebugDiv which is usually set to false:

To kickstart things, we are going to change the show_DebugDiv value to true

… and rebuild the application (or restart the server), so that the cache mappings are cleared
Next time TeamMentor opens up, you should see a little Table at the top:

… which can be moved around:

… and gives you three links:
- Open Trace View
- Open Trace View (and hooks)
- Setup Trace Hooks

... a larger version of the TraceViewer appears :)
There are a number of ways to interact with this Trace Viewer:
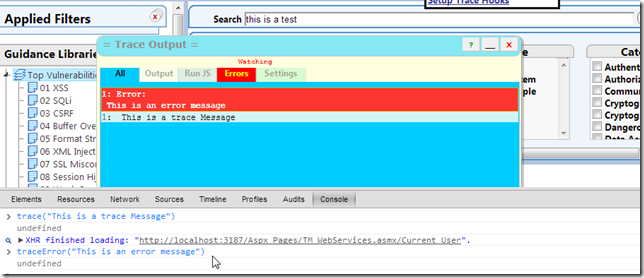
1) Syntax: trace(‘…message….’)

2) Syntax: traceErr(“…message…”)
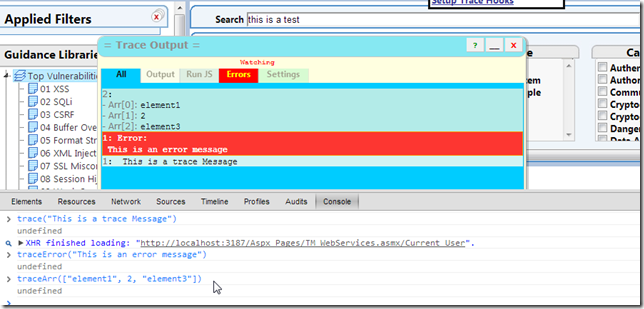
3) Syntax: traceArr([ .. javascript array.. ] );
4) Syntax: traceAssoc(… javascript object …)

5) Syntax: tracerInfo()

6) You can also access all these objects (without code complete) on the Run JS tab
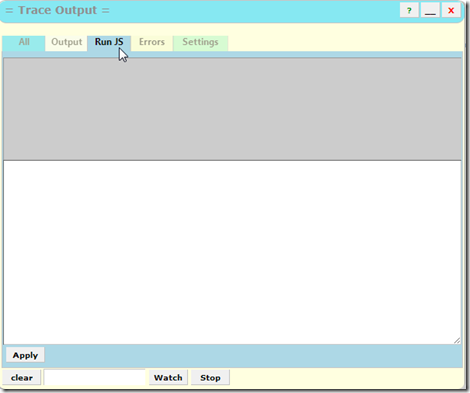
...by typing the javascript to invoke on the TextArea and clicking on Apply

7) Another powerful feature is the 'Watch’ which will monitor the value contents of a particular HTML Element.
For example this is how we can monitor the Search TextBox (note Watching label in red)
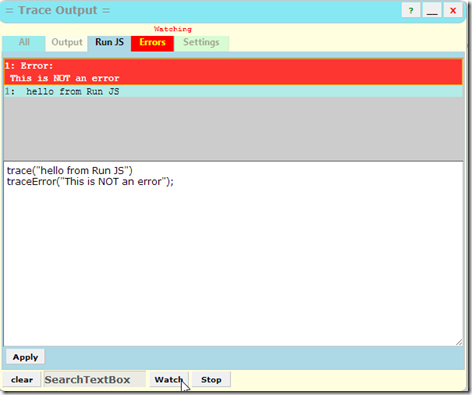
...and now every time we enter a new value on the textbox we will get an trace message:

Note if you want just the trace viewer to open automatically everytime TeamMentor’s main UI loads up, you can set the window.TM.Debug.show_TraceView value to true:

Tracing events execution
Ok, so now that we have this trace window open up, what can we do with it?
As mentioned above, the jscalltracer.js is also part of TeamMentor, and after a couple
customizations, it is set-up to add hooks on the main TM Methods invocations (including TM Events)
To see this in action , in the ‘debug div’ click on the Setup Trace Hooks link

...after about 20sec (depending on your box)
... you should see a number of ‘hooking ...' messages in the Trace Output:

If you now do any UI action (like for example clicking on a View), you will see an number of ‘event’ messages show up (note how they are shown in a Tree-like-format, which represent the call depth)
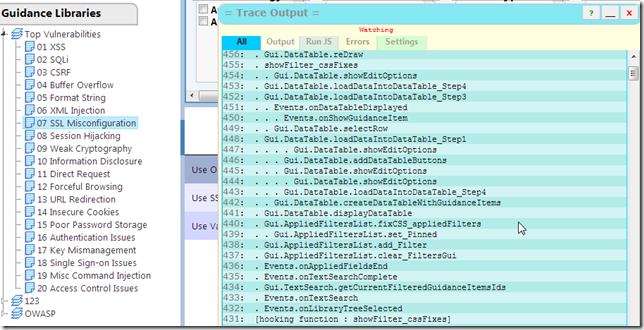
More examples of call traces:
1) events that fire when I clicked on the ‘remove filter’ button

2) event that fire when I clicked on an Article in the main Table:

3) events that fire when I clicked on one of the metadata filters (in this case the Apache technology):
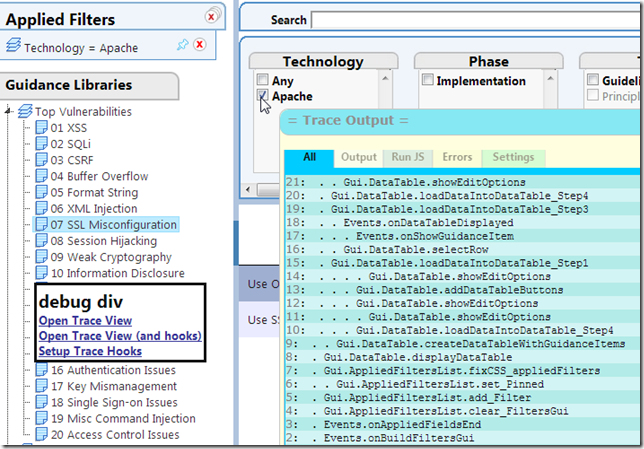
Finally, if you are debugging something that happens when TeamMentor loads up for the first time, you want to change the callTrace_LoadEnvironment and callTrace_LoadEnvironment_Before_Gui values

...to true

... so that you get all events
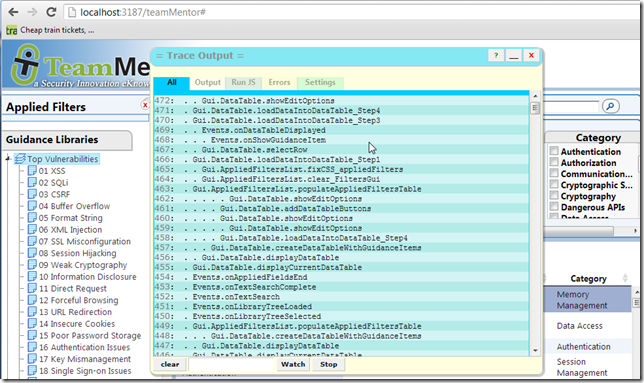
...including the first main javascript call that triggers the rebuild of the entire GUI (if you set callTrace_LoadEnvironment_Before_Gui to false, the first call captured occurs after the main GUI is loaded)


