With window.TM.Debug.callTrace_LoadEnvironment set to true:
1) Enabling window.TM.Debug.callTrace_LogToConsole

.... will also write the 'function call info' into the console (like Chrome developer tools of FireBug):

Tip: if you don’t want to see the Trace Output window, click on the top-right-red X

and it will be minimized into the bottom right corner (where you can click on it to reopen):

2) Enabling window.TM.Debug.callTrace_ShowParamsInConsoleLog

will add the call parameters to the console log:
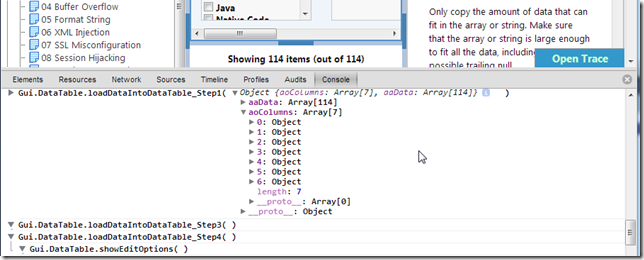
Another example showing the string values of the add_Filter call

3) enabling callTrace_ShowExecutionTime

will add a took ##ms message after each function returns (again very useful for debugging timing and performance issues)
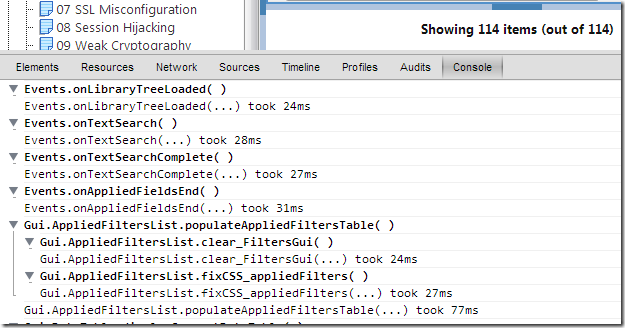
With window.TM.Debug.callTrace_LoadEnvironment set to false
The call trace is very good and powerful, but it does have a performance hit, and can generate too much data, so another useful debug tool is if we disable all callTrace_* settings

and:
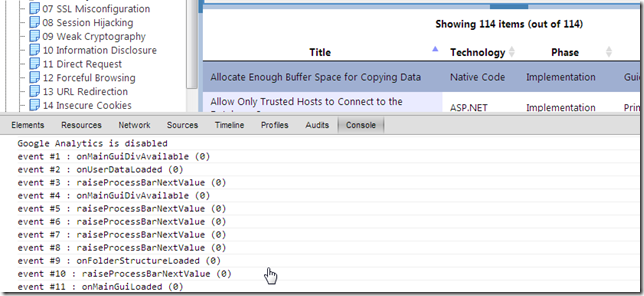
1) enable logEventsRaised
... will make TM write an entry to the console of all events raised:
2) enable logEventsRaise_CallTrace

...will add the Call Stack/Trace to each event call (great to see who triggered that event)
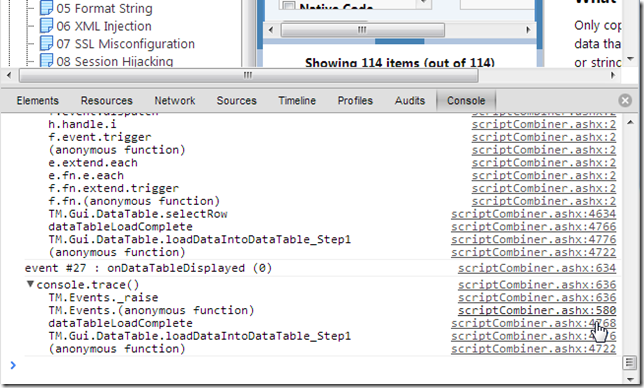
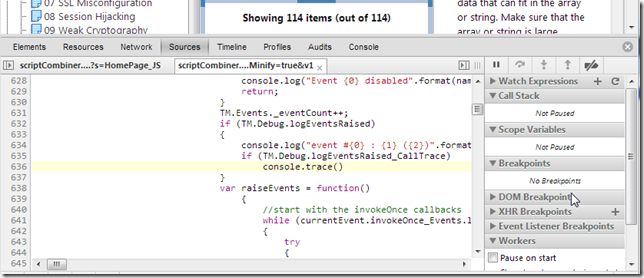
... with the added bonus that we can click on the function location and see its source code:

...you can even take a look at the TM’s Event-Driven-Architecture Solution code (based on jQuery events):
3) enabled logLoadedPages

... will show a real-time list of all html pages loaded (think of this as views):

Other debug options
There are a couple other smallish debug capabilities that can be configured by:
1) disabling LoadLibraryData

... which will load up TM without any libraries (useful when just debugging/testing the pure UI).

note how in the image above, the default TM UI has 46kb and loaded up in 698ms (which even for localhost access is quite nice and fast)
If we disable the addTimeStampToLoadedPages (to allow caching of the view html pages (instead of adding a random ?time=#### value to them)

and load the site from IIS

we get a main gui that has 4.4Kb of size and loads in 618ms

There is still some optimization room here since a lot of the 26 requests are for images which could be all served in one request:

