Here it is in action:

On the right you can see a full chrome window, inserted inside a VisualStudio dockable pane.
On the left you can see the AngularJs file (rendered from a RazorSharp template) that I can edit and quickly view its output on the right-hand-side Chrome window (with no web recompilation needed)
To create this, I searched in O2 Platform for the Util - Win32 Window Handle Hijack (simple).h2 script
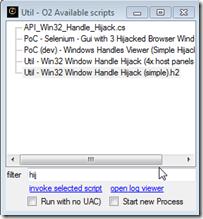 which looks like this:
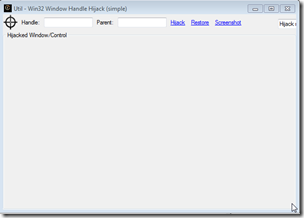
Had a look at its source code to see how it was created (note the Extension Method add_Handle_HijackGui ):

Then inside a VisualStudio, I opened a C# REPL script:

This gave me access to the VisualStudio_2010 API
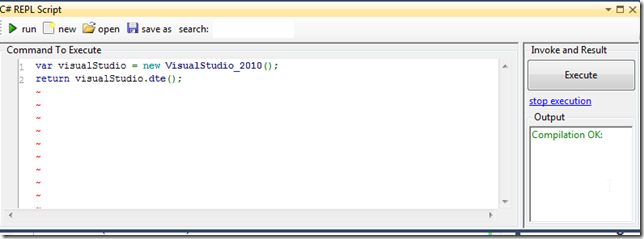
where I can use the Extension Method add_Handle_HijackGui
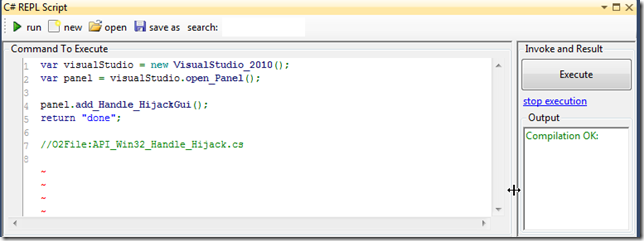
to create a native VisualStudio pane with the Windows Handle Hijack Gui
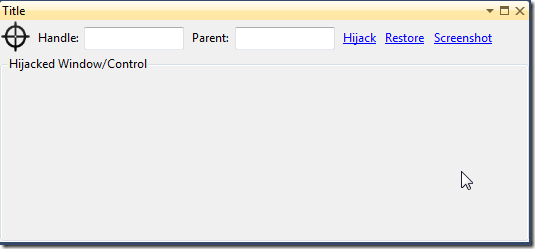
With this GUI, we can grab any Window's Window, by dragging the target icon (top left) into the window we want to use/hijack:
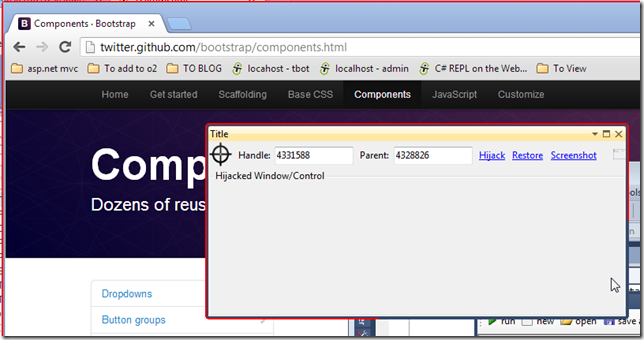
Tip: before Hikacking a window, it is a good idea to take a screenshot and see if we have the right one:

Once we’re sure, just hit the Hijack link, and we will have have a fully functional Chrome window that we can place anywhere inside VisualStudio's GUI.
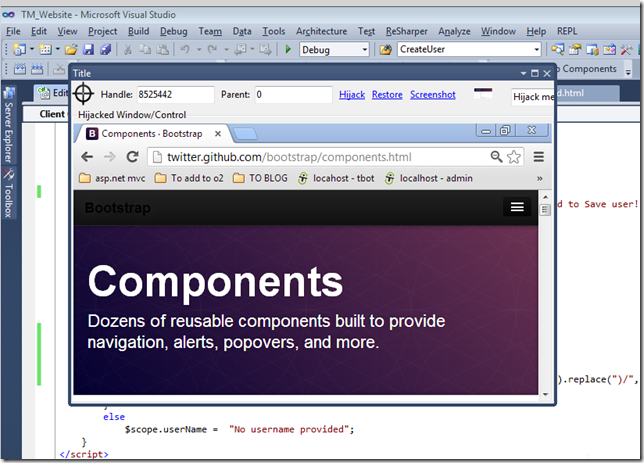
For example, we can place it in the documents area as one of the source code files
(tip: double click on the ‘Hijacked Window/Control’ text to hide the hijack controls)

As a final example, here is what it looks like if we just Hijack the browser’s website window (without the navigation and top bars)
