TeamMentor’s GUI is 100% Html/Javascript based (i.e. with no asmx or other-type of server side dynamic code).
This means that the data shown in the GUI is all fetched via AJAX (using jQuery).
To see this in action, look at the some of the calls made during main page load.

For example the /CurrentUser call which happens every 60 seconds (+10 sec on every time it is called)
Following Arvind’s question, let’s see how this /CurrentUser call is made :)
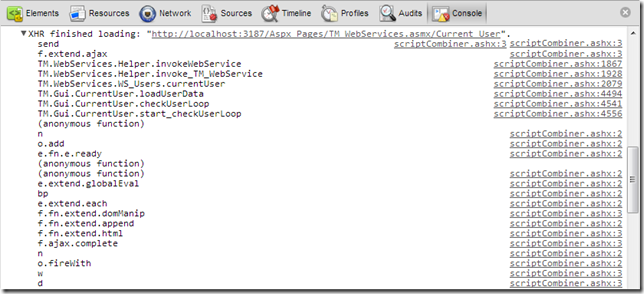
A good place to start is the stack trace that Chrome’s Developer Tools gives us

The TM.WebServices.WS_Users.currentUser is the function that calls the /CurrentUser Web Service

which is called from:

The TM.Gui.CurrentUser.loadUserData (shown above) is used on this ‘check if user is still logged in’ loop:

This answers Arvind’s first question on ‘who calls Current_User’.
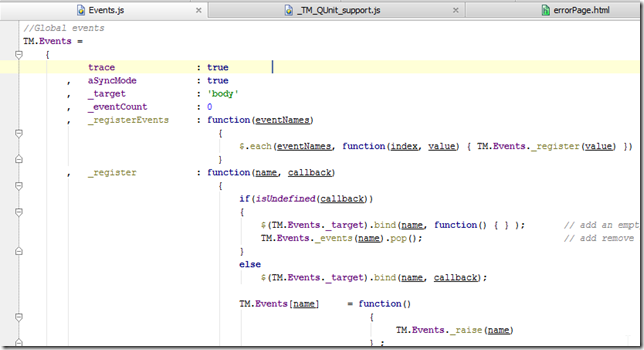
Ironically this checkUserLoop one of the few TeamMentor Javascript actions (including Web Methods invokes) that are triggered via a loop. Most other calls are triggered by the Event-Based model created by the Events.js file (and jQuery)

If you look in the TM.Events object you will see a number of mappings:

These Events can be set like this (with the parameter being callback):

And invoked like this:

To see these events in action, open the /Javascript/TM/settings.js file, find the logEventsRaised variable:
and set it to true:
Reload the TeamMentor GUI, and here are the events that were fired after doing a text search:

But to really see what is going on, a much better tool is the built-in trace viewer :)
To see it, set these TM.Debug.show_DebugDiv setting to true:

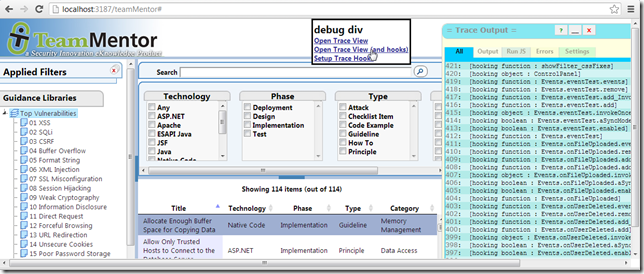
Refresh the Gui and notice the extra Div at the top

Click on Open Trace View (and hooks), and after a couple secs (it takes a little bit to set-up the Javascript hooks), you should see trace viewer on the right with a number of ‘hooking function’ entries:

And now, you will get an entry for every method called from the TM class/namespace called :)
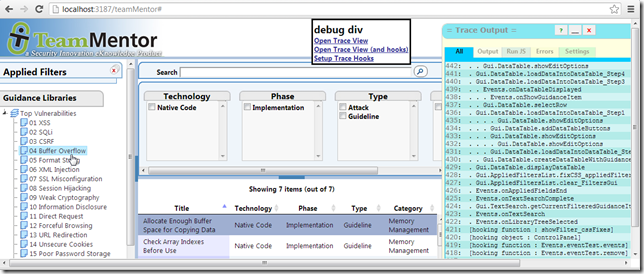
For example, here are the methods called when I clicked on a view (in the left-hand-side TreeView)

Note: If you want to try this locally, grab the latest version of TeamMentor's development fork from GitHub: https://github.com/TeamMentor/Dev