Using Groovy's ObjectBrowser:
Let's start with Groovy's ObjectBrowser which I used to use just about every day, since it gave me access to a live view of an particular Object's Fields, Properties (from getters) and Methods.
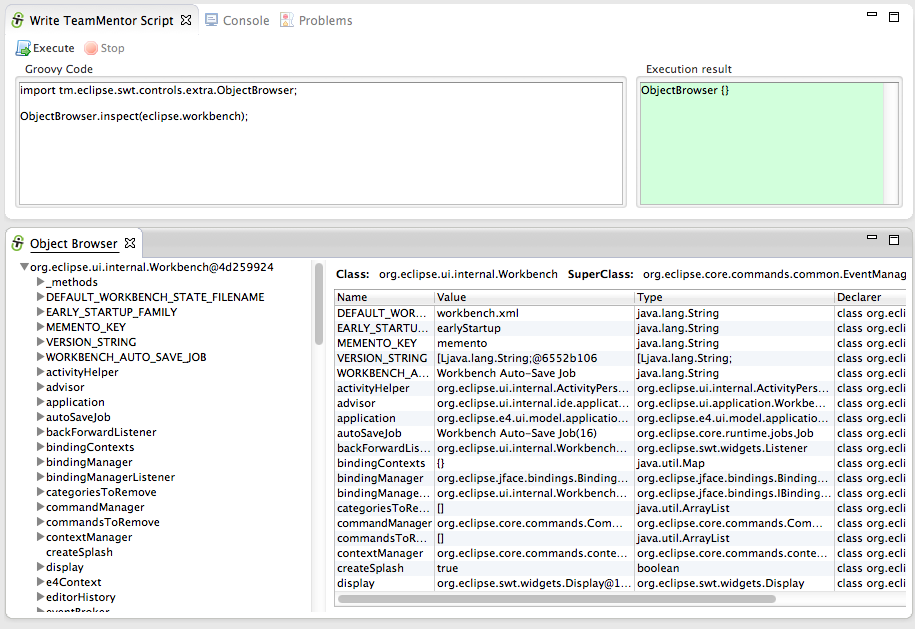
To see it in action, open the Write TeamMentor Script view (if don't have access to it , see install instructions here) which is basically a Groovy REPL (Read Eval Print Loop):
One of the problems with the Groovy's ObjectBrowser (an Swing UI shell), is that it doesn't allow you to zoom-in into inner/child objects.
So for example if you wanted to see the details of the Display object, which is exposed by the Workbench object, you would have to do something like this:
TIP: The Groovy REPL is injected with an live instance of the EclipseAPI object which exposes a number of these objects.
For example we could use the ObjectBrowser to see the workbench, display and activeShell objects like this (using the objects exposed by eclipse.workbench, eclipse.display and eclipse.shell):
In fact, the ObjectBrowser.inspect({object}) is also injected as Groovy method, so we can just use inspect({Object}):
Using TeamMentor's Plugin ObjectBrowser
Like I mentioned above, although I used to use the Groovy Object browser a lot, I didn't like its limitations, and eventually I was able to use the simpler SWT API (also shared by this plugin) to create a better version.
To see it in action, you can use this script:
...which will show the new version of the ObjectBrowser inside a native Eclipse view:
... that can be moved around inside Eclipse (as any other Eclipse view), or even opened up in a popup Shell:
This version of the ObjectBrowser (as the Groovy one) takes any object as input, and uses refection to show the fields, getters and methods.
On the left-hand side you can see the initial object provided (in this case the live Eclipse workbench object), which is quite a nice, big and juicy object:
In this case (when ObjectBrowser opens for the first time), the target shown will be the Eclipse's Workbench object:
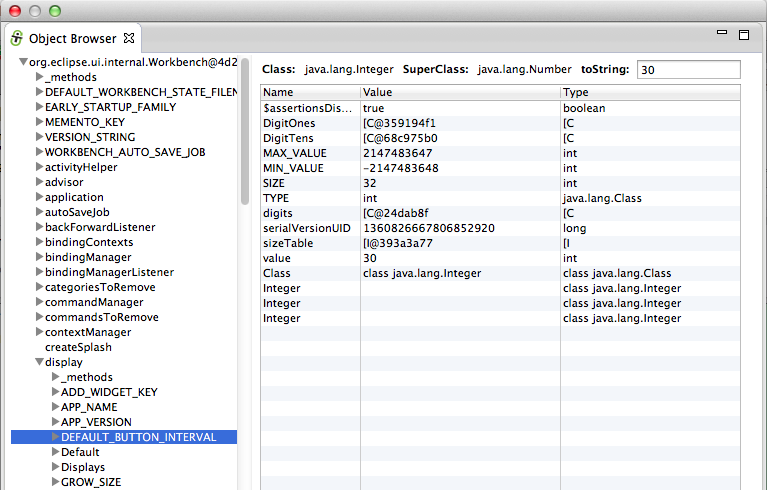
But instead of having to load the ObjectBrowser again to see the details of an another Workbench object (like the Display), we can just select it form the left-hand side treeview, and its contents will be shown on the right-hand side table:
In fact, you can even expand that node, and selecte other nodes to see the values of its fields and getters.
For example there is the Display object (which is exposed by the Workbench object):
For example here is the current activeShell object (also shown in the Groovy ObjectBrowser screenshots):
TIP: As with the Groovy ObjectBrowser inspect({Object}) injected method, there is also a show({Object}) method that will open the TeamMentor's ObjectBrowser view directly (with no need to add extra java packages imports):
Also useful is the fact that if a Collection (or Array) is given to ObjectViewer, the left-hand-side treeview will show each Collection item on its root.
For example, here are all the current visible/active Eclipse views in the current workbench (the eclipse.views.list() API call will be explained in another blog post)
That's it for this post!
Thanks for reading and I hope you see the value in this ObjectBrowser. I would love to have some feedback, so please take it for a spin, and let me know what what you think of it :)
You can use this update site to install it on Eclipse Indigo, Juno or Kepler (x32 , x64, Java 6 or Java 7)
Alternatively you run it from the source code or install it offline using a clone of the update site files


